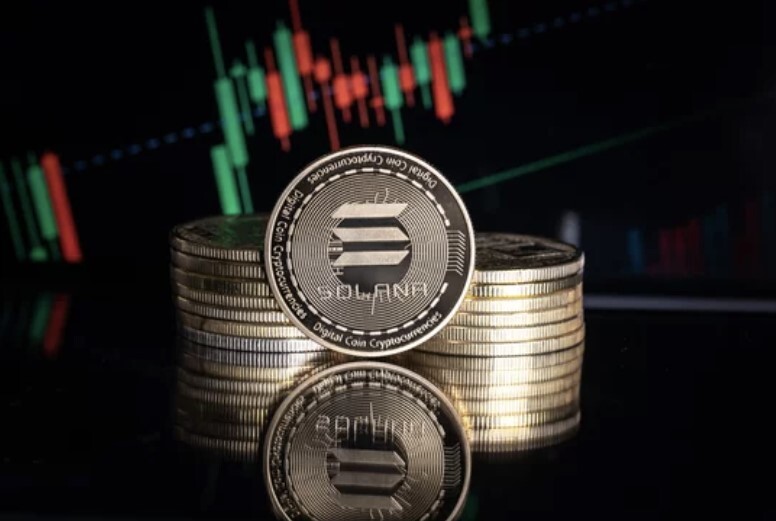
 ▲ Solana (SOL) |
Solana (SOL) is showing early signs of recovery, but warnings of further downside have emerged as a clear downward structure forms on the weekly chart. Despite market volatility, buying pressure is attempting to defend lower support levels. Nevertheless, the decline over the past month remains significant despite short-term rebound attempts.
According to The Crypto Basic, Solana remains well below its key daily moving averages: the 50-day at $106.86, the 100-day at $119.12, and the 200-day at $158.02. The downward alignment of these moving averages confirms that the mid- to long-term downtrend is still intact. Technical indicators suggest momentum remains tilted to the downside, limiting the potential for a move beyond a mere technical rebound.
Analyst Ali Martinez stated that Solana must decisively break above the 50-day moving average to confirm a clear trend reversal. He explained that securing this level as support would be the first signal of shifting momentum. Following a successful breakout, the rally could extend toward the 100-day moving average near $119.
The Awesome Oscillator, a technical indicator, remains in negative territory around -9.83, but signs of easing downward pressure have been detected. Histogram bars are gradually turning green, suggesting that selling pressure is weakening. If improving momentum coincides with higher price lows, it could be interpreted as an early recovery attempt.
Long/short ratios at major exchanges show prevailing bullish sentiment. On Binance, the long position ratio stands at 2.31, indicating strong buying dominance among top traders. However, high leveraged positions could pose a risk of increased volatility if support levels break, potentially triggering forced liquidations.
Martinez also outlined key support levels to watch on the weekly chart should the downtrend deepen. The first major support sits at $50.22, followed by a structural support level at $22.47. In an extreme bearish scenario, the price could fall toward the long-term bottom range of $9.98.
Disclaimer: This article is for informational purposes only and the publisher is not responsible for any investment losses incurred based on this content. It should not be construed as financial advice.