
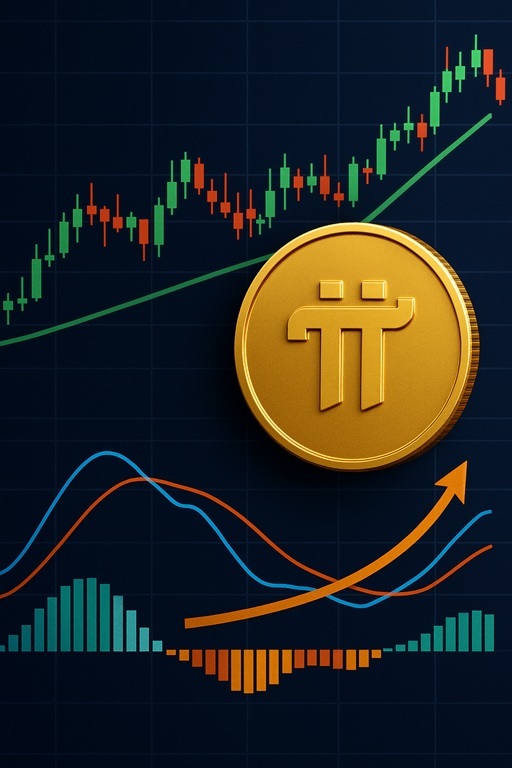
 ▲ Pi Network (PI) / ChatGPT-generated image |
Pi Network (PI) has completed a classic bullish technical pattern known as the cup and handle, consolidating momentum for a potential extended rally.
According to cryptocurrency media outlet BeInCrypto on March 6 (local time), PI has surged 25% over the past month and gained about 7% on the day, with a strong possibility of an additional 30% rise if a technical breakout occurs. Price action observed on the recent eight-hour chart suggests that the prolonged consolidation phase has ended and a new bullish cycle may be beginning.
After reaching a peak in mid-February, PI formed a rounded bottom, completing the cup formation, and is now passing through the handle phase—the final consolidation stage before breaking through resistance. Analyst Ananda Banerjee noted that if PI decisively breaks and holds above the $0.204 resistance level, it could quickly surge to the pattern target of $0.265.
The Chaikin Money Flow (CMF), a capital flow indicator, is showing bullish divergence by rising even as prices declined, suggesting that large-scale capital is quietly flowing in. Market sentiment indicators tracked by Santiment recently climbed to 6.37, reflecting strong expectations surrounding the upcoming V20.2 protocol upgrade scheduled around Pi Day 2026.
With a low correlation coefficient of 0.21 with Bitcoin (BTC), PI appears positioned to generate independent upward momentum regardless of broader market volatility. However, the On-Balance Volume (OBV), which measures cumulative trading volume, has shown a slight decline, indicating that retail investor participation has yet to fully accelerate—posing a short-term variable.
To maintain the bullish scenario, a breakout above the $0.204 resistance level is essential. Whether the $0.197 support level holds will serve as a crucial turning point in determining the next direction. However, if the $0.161 level collapses, the chart structure would be damaged, and a drop below $0.155 would completely invalidate the bullish outlook.
Disclaimer: This article is for informational purposes only and does not accept responsibility for any investment losses incurred based on its content. The information provided should not be construed as investment advice.